Your dollar’s purchasing power is shrinking faster than Joke Xiden’s cognitive skills. If you want to buy something, do it now. Venezuela is already printing million Bolivar notes, and they are worth all of 53 cents.
by Wolf Richter
The Consumer Price Index rose 1.7% in February from a year earlier, the fastest year-over-year increase in 12 months, picking up speed from the stall in April and May last year. Prices of goods are rising sharply, amid all kinds of shortages of durable goods after stimulus-fed red-hot demand, and food prices are rising too, according to data released by the Bureau of Labor Statistics today.
Price increases for services, the biggie, are held down by the battered discretionary services such as lodging, airline fares, and tickets for sporting and entertainment events, whose sales have collapsed.
- Durable goods (blue line) account for 10.9% of overall CPI (laptops, new & used cars, appliances, bicycles, etc.)
- Nondurable goods (green line) account for 26.6% of overall CPI (dominated by food and energy). Spiking & collapsing energy prices caused the larges moves of the index.
- Services (red line) account for 62.5% of overall CPI (rent, healthcare services, airline tickets, cellphone services, etc.).
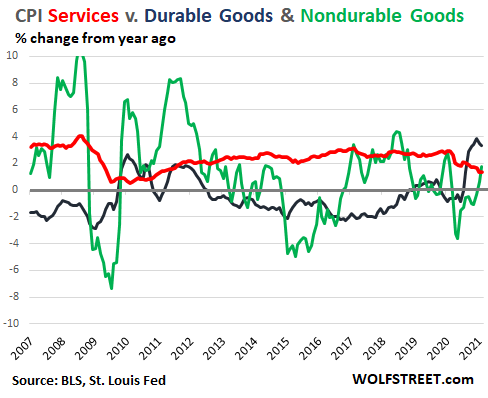
CPI for services (red line) rose 1.4% from a year ago, remaining at the lower end of the Pandemic range. This includes rent, homeowner’s equivalent of rent, healthcare services, insurance, but also airline tickets, and haircuts. Over the past decade, it has increased mostly between 2% and 3% year-over-year, but lost steam during the Pandemic as demand for services related to travel, personal care, events, and other areas plunged. For example:
- CPI airline fares: -25.6%
- CPI hotels, motels, etc.: -17.2%
- CPI admission to sporting events: -14.1%
Services, which dominate spending and CPI, is where inflation pressures will make themselves known because services account for two-thirds of the overall CPI.
Parts of the services economy have been hard-hit by the shift in spending from services to goods. And those sectors have responded by slashing capacity – and some purveyors of these services shut down for good. When this shift reverses, as people revert to buying airline tickets, staying at hotels, taking cruises, attending sporting and entertainment events, etc., this renewed demand will meet slashed capacity, creating price pressures that will feed into services CPI.
CPI for nondurable goods (green line) rose 1.7% from a year ago, the steepest increase in 12 months, after having dropped during the Pandemic amid collapsing prices of gasoline and other fuels. This category is dominated by the volatile prices of food and energy.
But gasoline prices are now rising. In February, the CPI for gasoline was up 1.5% from a year ago. And food prices in February rose 3.6%. This includes prices for food at employee sites and schools, where demand has collapsed, and where prices have plunged 24.5%, though I’m not sure how to track prices accurately when so many establishments of this type are closed.
CPI for durable goods (blue line) rose 3.3% from a year ago, remaining near the peak of the Pandemic price spike, amid reports of shortages, backorders, production delays, and transportation bottlenecks, as no one was prepared for the sudden and blistering demand for durable goods since spring.
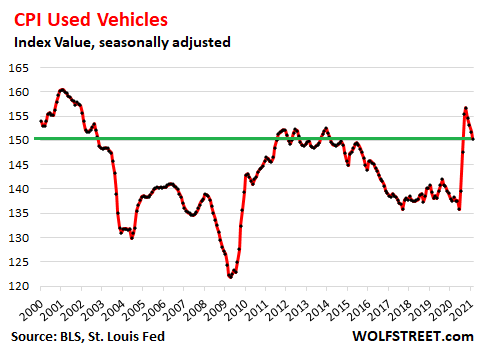
This surge in durable goods CPI includes the historic four-month spike in used vehicle prices, skyrocketing 15% from June through October, but that is now gradually backing off. The used vehicle CPI was still up 9.3% year-over-year.
The price surge in used vehicles was not a result of blistering retail sales – retail sales of used vehicles have been running below year-over-year levels for nearly the entire Pandemic, including in February, according to data from Cox Automotive.
Instead, the price increases are more likely a result of a change in pricing power at the dealer level, which has been documented by the record surging earnings despite flat unit sales at AutoNation, the largest auto dealer group in the US. And consumers are now willing to pay higher prices – those that can afford to buy.
But the method of how CPI is figured makes sure that, even as used vehicles get more expensive every year, the index value of the CPI for used vehicles, after various ups and downs, has actually fallen since the year 2000, thanks largely to the infamous hedonic quality adjustments.
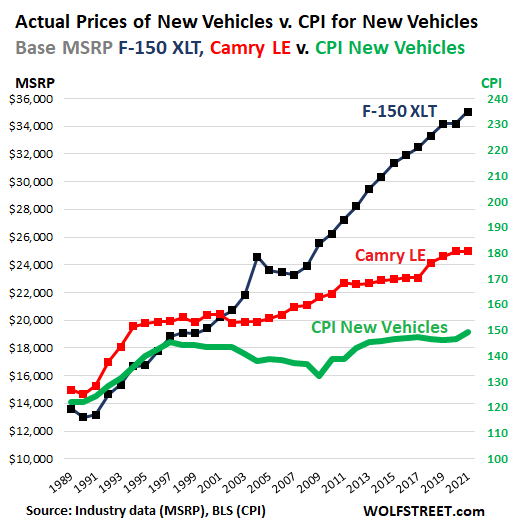
These infamous hedonic quality adjustments are also used to push down the new vehicle CPI, which has been essentially flat since 1997.
The power of these hedonic quality adjustments is demonstrated by my now equally infamous price index that compares the new vehicle CPI (green line) to prices of the F150, best-selling truck in the US, and the Toyota Camry, best-selling car in the US (I discuss the mechanics of these hedonic quality adjustments on new vehicles in detail here):
The politically incorrect term for consumer price inflation, which is what CPI tracks, is “loss of purchasing power of the consumer dollar,” and thereby the loss of purchasing power of labor denominated in dollars. And the purchasing power of the consumer dollar has dropped to a new all-time low in February, according to the BLS data today:
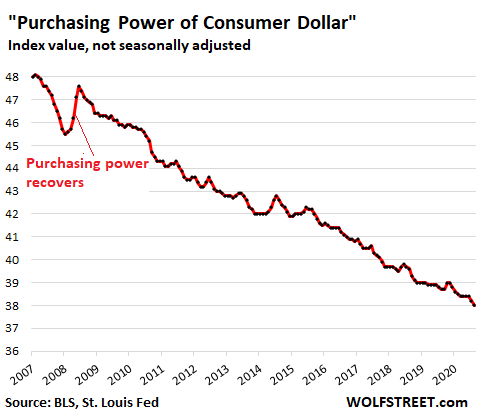
And now the Fed wants the dollar to lose purchasing power even faster, and thereby the Fed wants the purchasing power of labor to decline along with it. And by the dynamics now transpiring, it looks like the Fed will get its wishes fulfilled.